Annotations and Comments were added, in blue font, by Ken Myers, in December of 2021. Some of Larry's actual words were bolded and underlined, by Ken, to draw attention to specific statements.
3D Wing LoadingsA Better Way to Scale Models and
Thanks to Jim Yuzwalk for cleaning up this article a bit to make it easy to read, especially the tables.
It's common knowledge that it's important to have your model weigh a certain number of ounces per 100 sq. in. of wing area, right? Various wing loadings have been specified for this type of model and that type of flying. Debates over an ounce per square foot here or there can become pretty heavy. Note: Dec. 24, 2021 The term "number of ounces per 100 sq. in. of wing area" was new to me when I read this article for the first time. I have not seen it anywhere else since then, and that was a long time ago. Unfortunately, those debates are trying to resolve conflicts that are due to inadequate theory. Wing loading, as generally used, is very limited in the range where any given loading is valid. There is a much better way to evaluate the weight of a model and compare it to others. A really powerful theory will let you target the correct weight for a new model based on larger, smaller or different design models. Happily, such a theoretical solution exists and works well. Way, way back in August 1959, Ron St. Jean published an article called "Wing Loading is Three Dimensional", right here in Model Airplane News. This was before R/C really got going, so he was talking about scaling free-flight models. His article is still valid today. The basic concept is that when you go from a large model down to a small one, there's a way to determine the correct weight, despite all the changes to structure, power, etc. Ron's article showed that there was a valid mathematical relationship among all the various sizes of his "Ramrod" design. These models ranged from an .020 powered miniature at 3 ounces with 150 sq. in. area up to a monster .32-powered, 34-oz., 750-sq. in. version. By conventional wing-loading measures, his models ranged from a wing loading of 2.88 oz./sq. ft. for the .020 model up to 6.53 oz./sq. ft. for the .32-powered one. The key, though, is that the models all performed about the same! Hmm; what's going on here? By the "3D" formula that Ron used, the loadings came out the same within 3 percent! That's a little more like it, no? Note Dec. 24, 2021 Ounces per square foot (oz./sq. ft.) is used in the preceeding paragraph, not "number of ounces per 100 sq. in. of wing area". The problem with classic wing loadings is that they are only valid for comparison of models in a very narrow size and design range. If, for example, you scale a Lazy Bee to double size, what should it weigh? It turns out that the weight can go way up over what the "2D loading" for the standard Bee can handle without losing its delightful flying characteristics. Similarly, how would you compare a Sr. Telemaster to a half-size Lazy Bee? How about comparing a 7:1 aspect ratio, 1 1/2-meter, R/C hand-launch glider to an unlimited with a 12:1 wing? A theory of scaling that works correctly should allow such comparisons. To understand scaling and comparison techniques, you must first get a handle on what you're trying to do. In scaling a model from one size to another, you want a model that looks as if it is flying like the original one. There are other possible goals in scaling, but it seems to me that this one comes closest to what most people want. Mind you, this is a goal; reality will be discussed later. To make one model seem to fly the same as another, each model should fly the same number of wingspan lengths forward, the glide angle should be the same, the landing speed should seem similar, and the turn radius should be the same number of wingspan lengths. From this we should be getting a bit of an "Aha!"; big airplanes fly faster than small ones! Big airplanes fly bigger maneuvers than small ones and can land faster, too, without being unmanageable. Reality check: it's not possible to actually achieve perfect scaling of performance when scaling models downward; the small model carries too big a burden in R/C gear and hardware, Reynolds number extremes, and stability changes. The stability of a small model will be less smooth than that of a big one because the damping changes as the square of tail moment and wingspan. That is, a small model will respond more quickly and damp out more slowly than a big plane. Finally, the wing loading theory here does not take Reynolds number effects into account. However, you will find that the accuracy of comparison from large to small, or the reverse, is pretty darned good, way better than classic wing loading. This technique will also allow valid comparisons between very different model designs in different sizes. The following analysis is run in two parts. The first shows how to derive a wing load factor from existing models; the second shows how to use that factor to evaluate or design another model. There are several different equations that are all valid for dynamically similar models (scale up and down of a single design). When you want to compare different designs, one equation seems to be more useful than the others. OK! From the classic lift equation (lift = l/2r x V2 x SW x CL), it can be shown that for scaling identical designs, one mathematical solution is: (eq. #1, the equation, is shown below the notes in blue font. KM) Important Note: December 2021
NASA Modern Lift Equation
NASA The Lift Equation
While all four formulas appear different, the results ARE identical.
eq. #1 where "k" is a constant that is determined from your basic design. That little "1" after the "k" is just there to differentiate the constants from one possible equation to another. That "3/2" exponent on the wing area means either "cube of the square root" or "to the one and a half power". Either way, it is duck soup to solve with an inexpensive scientific calculator. This, by the way, is the "cubic wing loading" equation that Ron St. Jean used. It is simple but lacks the ability to compensate for design variations and also needs a scientific calculator to solve. Note: December 2021 The Imperial Units used for the classic "MODEL wing loading are ounces (oz.) and square feet (sq. ft.). Solving for k, which is noted as k1 here, using eq, #1 and the data for the standard Lazy Bee from the table below. 24 oz. / k1 * 500 sq. in.^1.5
An alternative equation that takes the wingspan into account is: eq. #2
This version is interesting because it deals with the volume of air affected by the model as it passes by. The volume is roughly a circle of the diameter equal to the wingspan times the velocity of the model per unit time (also a function of wingspan). It is my opinion that this version places too much emphasis on the benefits of high aspect ratio when scaling from one model design to another. I suspect that a careful review of existing models would show that the comparisons between different designs is not as accurate as we would like. Also, again, there is that pesky cube root term. Note: December 2021 Solving for k, which is noted as k2 here, using eq. #2 and the data for the standard Lazy Bee from the table below. 24 oz. / k2 * 40 in.^3
Yet another equation that has some adherents is: eq. #3
This version clearly attempts to take into account the total effect of wing design. You can look at it as using the volume of the model's wing to calculate a model weight density. Two problems with this version of the equation, as I see it are: 1. average thickness is hard to calculate; 2. airfoil thickness is just not that good a measure of airfoil performance. For example, a thin, highly cambered airfoil will provide lift and drag very differently from a symmetrical airfoil that has the same total airfoil height. Just which height do you measure to use this equation? As shown by all the recent research by Selig and his friends, airfoils are very tricky things to deal with unless you have the specific data for your airfoil as built. Now, finally, the equation I prefer! eq. #4
It's simple, easy to calculate with a regular $4 calculator, and it takes aspect ratio into account. This equation works very nicely for scaling any given type of model from one size to another despite surprisingly large variations in design. The mathematical derivation of equation #4 is given in the sidebar (Sidebar and glossary at end of article KM). An interesting point, by the way, is that for precisely scaling a particular design up and down, all the above equations will give you exactly the same answer! Neat, huh? Only the "k" constant will change from equation to equation. The reason to select this particular equation is that in real world comparisons of a variety of designs it seems to work better than the others. From here on, we are only going to discuss equation #4, so what was "k4" will become simply "k". In addition, I am going to specify that this article will use the units: Wing area: square inches k: ounces/in.3 December 2021 Note: He doesn't explain why inches and not feet. It is interesting to note that the "k" constant is a true weight density factor. At the end of this article, I'll give you conversion factors to use if you like other unit systems such as gm/cm or lb/ft.
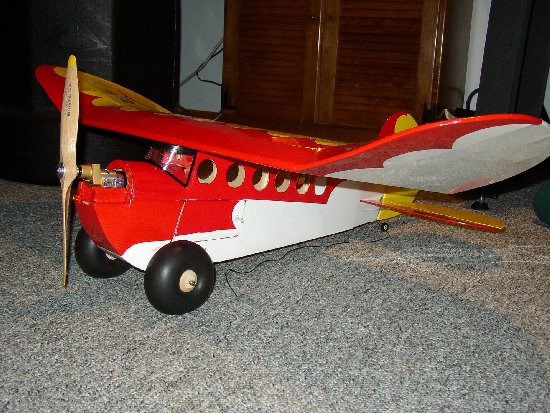
Let's run through an example, Just to demonstrate how to calculate 3D wing loading. In this case, we will use variations of the Lazy Bee. The basic Electric Bee shown in the photo has a wing area of 500 sq. in., wingspan of 40 in., and weighs 39 oz. By use of a bit of basic algebra, we switch the equation to read: eq. #5
39 oz./(500 sq. in. x 40 in.) = .00195 oz./in.3 Now using that technique to derive "k," let's calculate the factor for the Electric Bee, Electric Big Bee, an .020-powered Lady Bug, and the Sr. Telemaster. See the chart to compare the 2D and 3D wing loadings for this list of models. You can get an idea of their relative performance capabilities of the models based on the k values.
Note Dec. 2021: To ME, what is listed in the table as "Classic Wing Load" is NOT the classic oz. per sq. ft. but the more unusual oz. / 100 sq. in. So, what does this tell us? Several things, actually. First, you can see that the k-factor comparison is a lot more constant than that of classic wing loadings. The 3D wing loading gives you a much more accurate idea of the performance you will get independent of size. Experience with the actual models certainly tells us that the Electric Bees will fly "hotter" than the original glow-engine-powered Bee; also that the .020 version is likely to be on the heavy side for its size. Finally, we know that the Sr. Telemaster is one of the all-time slow flight capable models. All this correlates beautifully with the k factors in the chart. Note Dec. 2021: The .020 Lady Bug has about the same k value as the Electric Bee and the Big Electric Bee. Another way to look at this chart is to now use it to judge the wing loading of new designs. We can now, for instance, specify that any electric R/C Lazy Bee of any size ought to have k = .002. Similarly, to perform in the typical fashion, a gas-powered Bee should have k = .0012. By use of the formula, you can examine either the wing load that you have, or the ideal weight for a particular plane. As such, the .020 model with its k = .002 is too heavy at 5 ounces, and the weight needs to drop to 3 ounces to bring its performance in line with the other gas-powered Bees. However, it is easy to see that it will fly and perform about the same as the Electric Bees in the big sizes, since it has the same k as they do. Check out the fact that the k values of a Sr. Telemaster and a standard Lazy Bee are comparable. The difference in 3D loading is less than 10 percent compared to nearly 300 percent for 2D loading comparisons! Again, experience tells us that the flight "appearance" and docility of the Bee are, indeed, comparable to those of the Sr. Telemaster. At this point it's worth saying a word or two about "Reynolds number" (Rn). Yes, Reynolds number effects exist and will affect the accuracy of simple scaling techniques, but the degradation of going from a high Rn (big model) to a low one (small model) is on the order of 15 percent and opens an entirely different can of worms dealing with optimum airfoils for different speed ranges. The effects of density factors as represented by comparing 2D and 3D wing loading are, as you have seen, more on the order of 100 percent to 300 percent, and should always be considered. Finally, we get back to the original purpose of the article: a technique for determining the correct weight for a scaled model. In this case, let's scale the original glow engine Lazy Bee up to twice its size. With the wingspan doubled, the wing area becomes four times as big, or 2,000 sq. in. By use of equation #4, the correct weight is easily calculated to be 192 ounces. This weight correlates well with that of the smaller Sr. Telemaster. Note first that these numbers give you an equivalent flying model. Second, the numbers for the Monster Bee look about right using 3D scaling, while if you tried to hold the 4.8 oz./l00 sq. in. 2D loading, you would have come out with a model weighing only 96 ounces. A model that light and of that size would be entertaining but would fly quite differently than a standard Bee. Table 2 presents rough values of k for various types of models. Note that these were generally taken from a single, but very typical, example of the model type just to give an idea of the relative relationships. You can refine these k factors by averaging the numbers from several different sizes and designs.
Note Dec. 2021: It could be just me, but I find holding these small decimal numbers in my head very difficult when comparing one model to the next. It would have been useful if he had arranged the values of k, for this equation, in some type of order.
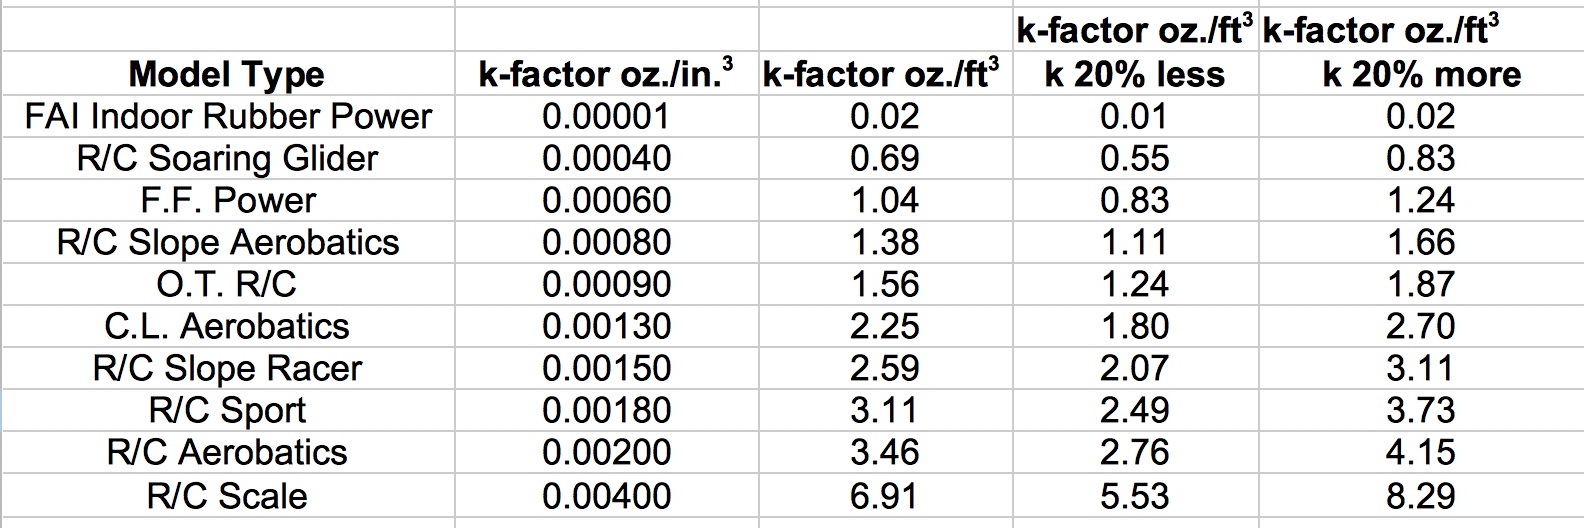
You can see that the faster, hotter model types have a larger value for k. I think that if you check out some of your favorite models, they will fall very close to the values given. I would expect a good flying model to have a k within about 20 percent of that listed for its type. There are a couple of surprises in the chart. R/C soaring gliders have a lower loading than free-flight power models; this must be the effect of the extreme aspect ratios. On the other hand, the glide of a good soaring machine is much flatter than that of a free-flight's, so I guess the numbers work out pretty well there too. Not everyone wants to use the ounce and inch units I prefer. The following table gives conversions so you'll be able to change the units as you please and recalculate the k constant. Here are some conversion factors for "k" to change from the oz. in.3 used in this article to the units you want. This chart lets you take the k's from this article and convert them to your preferred system. It should take care of just about everyone, including any model-flying druids who happen to read Model Airplane News. Note that once you have established your unit system and calculated your k in those units, you no longer need to apply any conversions; that is, if you start in the stone/furlong measurement system and stay there, you never need a conversion factor.
Table 3. Unit conversion table for k-factor CONCLUSIONS So, it may take a bit of getting used to, but if you use 3D wing loadings, you will have a much more useful and accurate estimate of whether your model is the correct weight. You can compare weights of different designs in a more meaningful way as the formula provides some correction for changes in aspect ratio. Finally, you now have a powerful tool to use when scaling models from one size to another in order to get an accurate estimate of the new size and weight. In the following derivation, the constant k will be arbitrarily numbered as we go through the equations. It is not necessary to worry about the real value of the final k or its subscript as we calculate the real k from a reference model as shown in the article. To begin with, the standard formula for wing lift is: eq.#10 lift = l/2r x V2 x SW x CL For simplicity, let's set the result of all the constant terms equal to k1. We have decided to scale the speed and turn radius to match the new wingspan, while holding Cl constant for similar flight response, so we can set up two more equations: eq.#11 V = k2 x b eq.#12 R = k3 x b And since acceleration in a turn is: eq.#13 a = V2/R we can substitute V (#11) and R (#12) into the equation for (#13) and get: eq.#14 a = (k2 x b2) / (k4 x b) = k4 x b Lift required in a turn is: eq.#15 L = W x a = W x k4 x b So setting our two equations for lift equal to each other (#10 and #15): eq.#16 W x a = k1 x V2 x S Substitute In the term for "V" (#11) and "a" (#14), and you get: eq.#17 W x k4x b = k1 x k22 x b2 x S Solving this equation for "W" and combining all the constants into a new one: eq.#18 W = k5 x b2 x S/b = k5 x b x S ...which is the formula that is used in the article as equation #4. Acceleration (a): the rate of change of speed of the model in a maneuver. This is related to the speed and tum radius. Airfoil thickness: the distance from top surface of the airfoil to the bottom at a given position on the chord. Usually, we only look at the thickest point, and specify that as a % of the chord distance. Aspect Ratio: the ratio of wingspan to average chord. Camber: the curvature of the center line of an airfoil's thickness profile. Chord (c): the distance from the leading edge of an airfoil section to the trailing edge. In this article, we are only interested in the effective average chord for the whole wing. Coefficient of lift (CL): a factor related to airfoil type and angle that allows calculation of actual wing lift. Constant (k): a catch-all letter to stand for any number that doesn't change. Density (r): a mass/volume measure. Drag (D): the force resisting forward motion. g: the free-fall acceleration of objects at the Earth's surface. L/D (lift to drag ratio): this determines glide angle and also the speed for a given amount of power available. Higher values are better. Lift (L): lift required to support and maneuver the airplane. Scaling factor (S): how much bigger or smaller the new plane will be than the old one. Thrust (T): the force available to provide forward motion. Turning radius (R): the size of a maneuver such as a turn or loop. Velocity (V): the speed of the model relative to the air. The ground speed is unimportant to aerodynamics. Wing area (Sw): the area of the wing's shadow at high noon. Wingspan (b): actual distance, tip to tip with the wing built. Weight (W) : the force downward produced by the stationary model at sea-level. Actually the model's mass times 1 "g." Ken Myers' Table and Info Follows
The table shows Larry's k factor and my conversion to ounces per cubic foot. It also shows the range, plus and minus, 20% based on Larry's numbers and examples. Many "new" categories of planes have been added since the time of the writing of Larry's article, and they are not covered here.
|