 |
Flying High With Electric Power!
The Ampeer ON-LINE!
Fly the Future - Fly Electric! |
|---|
Site Table of Contents
| President: | Vice-President: | Secretary-Treasurer: |
| Ken Myers | Richard Utkan | Rick Sawicki |
| 1911 Bradshaw Ct. | 240 Cabinet | 5089 Ledgewood Ct. W. |
| Commerce Twp., MI 48390 | Milford, MI 48381 | Commerce Twp., MI 48382 |
| (248) 669-8124 | (248) 685-1705 | (2480 685-7056 |
 | ||
| Board of Directors: | Board of Directors: | Ampeer Editor |
| David Stacer | Arthur Deane | Ken Myers |
| 16575 Brooklane Blvd. | 21690 Bedford Dr. | 1911 Bradshaw Ct. |
| Northville, MI 48168 | Northville, MI 48167 | Commerce Twp., MI 48390 |
| (248) 924-2324 | (248) 348-2058 | (248) 669-8124 |
| The Next Meeting: Date: Saturday, Sept. 2 Time: 10 a.m.
Place: Midwest RC Society 7 Mile Rd. Flying Field | ||
| Reminder About EFO Flying Season Meetings Ken shares that EFO Flying meeting dates are tentative. | Measuring a Battery Pack's Internal Resistance (Ir) Ken discusses how to measure this battery characteristic using examples. |
| Upcoming Midwest Swap Shop Upcoming November Midwest RC Swap Shop Info | CARDS 7th Annual Electric Fly In Event Announcement |
Dates given for the flying season EFO flying meetings are tentative. The date depends on the weather and may change from the one noted in the monthly Ampeer. The EFO Web site has the most current information posted. Also, emails are sent to EFO members if a date change is required. |
By Ken Myers with Input by Dave Stacer Why Bother Measuring a Battery's Internal Resistance? The ability to sustain high currents, at usable voltage levels, can be ascribed to the battery's internal resistance value, or Ir value (Rint). Battery, and individual cell, internal resistance is a major discussion topic in the "Batteries and Chargers" forum on RC Groups, and it seems to be of great general interest to some electric fliers. Electrical resistances are measured in ohms (Ω). A battery pack's internal resistance is quite small. The internal resistance ohmic value is sometimes presented in milliohms (mOhm). One ohm is equal to 1000 milliohms. Therefore, the value of 0.05000 ohms multiplied by 1000 is 50.00 mOhms. It is somewhat easier, for many of us, to comprehend a whole number with a couple of decimal places rather than to try and comprehend five thousand, one hundred thousandths. That is 5000 out of a possible 100,000. It can also be written as the fraction 5000/100000. While 5000 of something seems to be quite a large value, it is only 5% of 100,000. If a popular concert venue seated 5000 people and 100,000 people wanted tickets to the concert, only 5 people out of every 100 people could get tickets. The point is that the ohmic value for a pack's internal resistance is extremely small and even smaller for a single cell in the pack. The following section deals with some math. Please don't turn off to the simple math presented here. In a mathematical formula, functions inside parentheses are calculated first. The remaining function, or functions, are performed on the result of what is in parentheses. The following formulas are explained later. They are presented here to demonstrate how the values displayed on a measuring instrument can affect the results. (11.5-11.1) / 8.5 = 0.04706
(11.47-11.06) / 8.46 = 0.04846 (3% difference in the result)
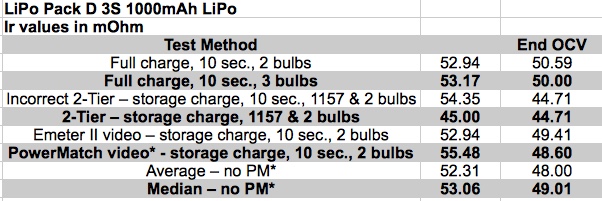
The second equation could be the same as the first, if the values were rounded to the tenths place instead of the hundredths place. If the results were in ohms, then 0.04706 ohms would be 47.06 mOhms and 0.04846 ohms would be 48.46 mOhms rounded to the nearest mOhm they would be 47 mOhms and 48 mOhms. For our purposes, they can both be rounded to 50 mOhms. The number of decimal places presented should not be confused with the precision of the measuring instrument and the precision of the end result. As battery packs age, they lose their ability to provide high currents at useful voltages. As the internal resistance increases, the voltage loss under load, due to the increasing internal resistance, is sometimes very significant. A battery's internal resistance also increases due to end user abuse. Charging at too high of a current and discharging at too high of a current causes increases to the battery's internal resistance. Using a battery at too low of a temperature, along with too high of a current draw, causes permanent damage to the battery and an increase to its internal resistance. Using a battery at too high of a temperature, along with too high of a current draw, causes permanent damage to the battery and an increase to its internal resistance. A LiPo battery is extremely susceptible to physical damage. The pouch of a LiPo battery provides little protection against physical damage. Physical damage to a cell, or cells, in a LiPo pack, will increase the battery's internal resistance of a cell, or cells, and the pack as a whole. Internal resistance measurements, of the same battery, over time, allows the pack's 'health' to be compared to previous internal resistance measurements, if records are kept on the pack. The comparable values indicate how well, or poorly, the pack is aging. Of course that can also show up as 'poorer' flight performance of that pack over time. Internal resistance measurements, taken at the same state of charge (SoC), at as close to the same pack temperature as possible, using the same measuring device and methods, can be used to compare packs of the same type of chemistry and capacity to each other. The comparison yields a predictive result between the packs. The same chemistry and capacity batteries, with the lowest internal resistance, allow higher currents to be drawn without excessive heating of the pack. Overheating a pack adversely affects the normal aging of the pack. A pack with a lower internal resistance allows for better performance. Lower internal resistance packs, of the same chemistry and capacity, have a longer useful lifespan, compared to higher internal resistance packs of the same chemistry and capacity in many applications. There is no one 'best' internal resistance measurement for a given capacity pack. The measurements are always comparative. Comparing internal resistance values between the same chemistry, but with different capacities, is difficult, if not fruitless and pointless. For the same chemistry, higher capacity packs have lower ohmic values. For the same chemistry and capacity, heavier packs have lower ohmic values. For a battery internal resistance (Ir) ohmic value to be useful, the results of measuring it must be consistently comparable to itself and computationally close to measured values during testing, when measured at approximately the same pack temperature. For internal resistance measurements to be consistently comparable, a battery, or batteries, measurement(s) must be recorded at the same state of charge (SoC) and as close to the same pack temperature as possible. For SoC, I use a stabilized 3.85V per cell for LiPo batteries and 3.39V per cell for A123 Systems' batteries. Using 3.85V per cell is convenient for LiPo batteries because that is near the 'recommended' storage voltage. 3.39V per cell for A123 Systems cells is near the median voltage, and away from the full charge voltage and the 'empty' voltage. Consistent SoC use is more important than the actual voltage value. It just has to be consistent. For comparable results, the pack, or packs, being compared must be at approximately the same pack temperature. I use 22 degrees Celsius (C) to 24 degrees Celsius (C), that is 72 degrees Fahrenheit (F) to 75 degrees Fahrenheit (F). I am fortunate to have a location in my house where packs can be heat-soaked to that temperature range year round. Dave Stacer made a temperature controlled box to get the battery, or batteries, to the desired temperature before doing battery Ir measurements. The method described here considers the voltage drop of a battery pack under load to be caused by a pure resistance. In reality, it is much more complicated than that. This method is used because it is simple, relatively easy to do with typical electric flight modeling power system measuring instruments, and close enough for our purposes. Note that in the following recommended videos, Steve refers to a 'cell', but his explanation is also true for a battery pack made up of multiple cells. The calculated ohmic value for a pack also includes other resistances including the resistance of the interconnects, power lead wire, connector(s), etc. A video, describing how this method works, by Steve4Physics titled, "GCE (A-level) Physics E15 Internal Resistance 1 of 4" is found on YouTube. Note: I suggest watching it from the beginning to 5 min. 8 sec. of the video. and GCE (A-level) Physics E15 Internal Resistance 1 of 4" GCE (A-level) By Steve4Physics Note: The first 5 minutes and 20 seconds of the video are adequate to understand the concepts presented in this article. To simplify what Steve demonstrated, the pack's internal resistance, in ohms, equals the stabilized open circuit voltage (OCV) minus the volts under load and then that result is divided by the amps under load. A lot of examples can be found on the Internet for calculating a pack's internal resistance using the suggested formula. All of the sources, that I found, recommend a specific time period for the load to be 'on'. Ed, of Experimental Airlines, has a very good Web site covering a lot information regarding electric flight and simple electric airframe design. He demonstrates this technique in his video titled, "LiPo INTERNAL RESISTANCE", May 2014. Note: The first 7 minutes and 30 seconds of the video demonstrate the technique. In the video, Ed provided information on the usefulness of an Ir measurement. He demonstrated the simple tools and technique he used to calculate a pack's Ir. He used two 50W 12V Halogen bulbs in parallel as the load. Three or more of these bulbs can be used in parallel to increase the amp draw for larger capacity batteries. I have used both two and three 50W 12V Halogen bulbs in parallel when determining the Ir for my 3S 1000mAh LiPo packs. For 4S through 6S packs, a second set of bulbs, wired in parallel, should be attached in series to the first set of bulbs to handle the voltage. Ed recommends testing for Ir using a fully charged pack. He used 10 seconds for the time period to have the load 'on' the battery. Like Ed, for decades I used this technique. My example, which I will call "LiPo Pack D", is a 3S 1000mAh pack. I consider it to be 'very good' compared to my other 3S 1000mAh packs. In January 2016, I did five discharges of my example battery. The results, using Ed's technique and 10 seconds for the timing period with my 3 bulb discharger and an Emeter II, as the measuring instrument, are presented in the following table. 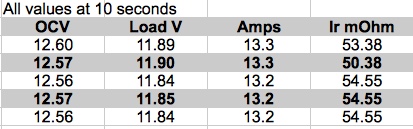 The table illustrates how very small changes in the stabilized open circuit voltage (OCV), Load Volts or Amps can affect the results. The pack's Ir values in Jan. 2016 are the same as the value I derived in July of 2017, 53.2mOhm, using this method and the same testing equipment. Note that the values that were calculated in the table were from a 'fully charged' pack. As previously mentioned, I now use 3.85V per cell with LiPo packs.
It is important to remember that the computed value is the internal resistance for the whole pack, including the resistance of the interconnects, power lead wire, connector(s), etc., not a single cell. My records indicated that it had been used/cycled 34 times at the time of the test. The pack is performing the same today, in the same airframe, equally as well now as it did last year. It stays as cool as ever during similar flights. Flight duration has not changed. The cells stay well balanced. The voltage drop during storage is negligible. The preceding paragraph was based on subjective data. Empirical data for this pack confirms the observations. On Jan. 05, 2016 I did a deep discharge test of this battery. The battery was discharged into three 50W 12V Halogen light bulbs in parallel and the data was recorded by an Emeter II. The deep discharge test was repeated on July 16, 2017 using the same equipment at the same pack temperature. 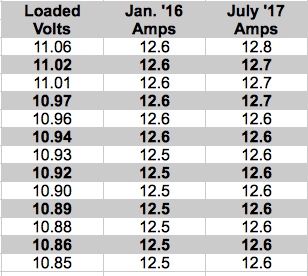
LiPo Pack D 3S 1000mAh Pack Compared Over Time The table shows the recorded amp draw on both dates at the same loaded voltages, using the same test instrument, an Emeter II. There appears to be no significant change. This data confirmed my subjective observations. This technique was what I used for decades to determine a pack's internal resistance, including NiCads and NiMH packs. On July 29, I used the same technique and equipment to compare a subjectively lower performing 3S 1000mAh pack with my example pack. In January of 2016, using this technique, the lesser performing pack had an internal resistance of 87.60 mOhms. Using the same technique, in July 2017, at 3.85V per cell, the calculated Ir was 95.08 mOhms. The pack had 31 cycles on it at that time. There may, or may not, have been an increase of 7.5 mOhms, that is 0.0075 ohms, for the whole pack. The ohmic values are small and the method's accuracy is somewhat questionable. A video by Bruce Simpson, of RC Model Reviews, emphasized a couple of considerations that were not previously taken into account when using Ed's 10 second discharge method from full charge. The video titled, Turnigy Graphene batteries: calculating the internal resistance", May 2016, is found on YouTube. His video is 19 minutes and 18 seconds long. Things I Noted in His Video Bruce used the equivalent of one 50W 12V Halogen bulb as the resistance for his load. He used a storage voltage, 15.08V for his test, not full charge voltage, that's about 3.77V per cell. He demonstrated the effect of dynamic relaxation. The dynamic relaxation effect is the voltage rise noted after the load is removed. More information about dynamic relaxation can be found at the maxim integrated Web site. The information is found under the heading "Accurately Measuring Charge Level" on the Web page. Bruce noted that when the battery is discharging, the battery's overall open circuit voltage (OCV) is dropping as well. I believe that he tried to eliminate the effects of the surface charge and the passivation effect by preloading the battery with an 1157 indicator/brake light bulb. Surface Charge
Passivation Effect
"After a load is placed on a cell, the high resistance of the passivation layer causes the cell's voltage to dip. The discharge reaction slowly removes the passivation layer thereby lowering the internal resistance of the cell. This in turn causes the cell's voltage to reach a peak value which should remain steady if other discharge conditions do not change." 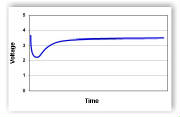 The graph above was copied from the Spectrum Batteries Web site and demonstrates the passivation effect on a cell. 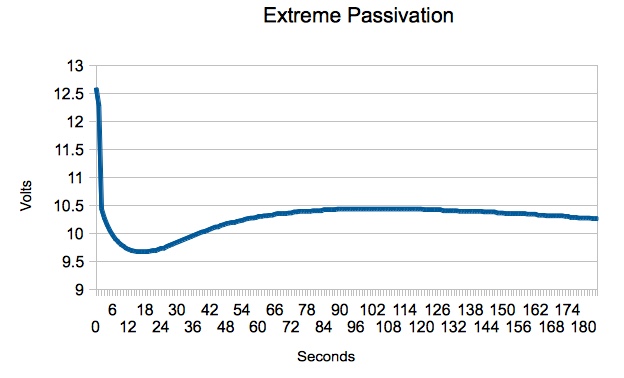 My graph, "Extreme Passivation", shows an actual 3S 1000mAh LiPo pack's voltage, Pack G, under load over time. The graph was created using data from one of my own packs. It is presented as an extreme example of the passivation effect on a pack and clearly demonstrates the effect on the whole pack is similar to that on a cell. At first, I thought that Bruce was trying to use the 2-Tier DC Load method. His light amp draw 1157 bulb could be seen to be 'on' during all of the Ir test. When the higher amp draw load was switched on, it was in parallel with the light amp draw load. He measured the voltage of both loads and amp draw of ONLY the higher amp load part of the parallel circuit. Using Bruce's 'not exactly correct' method in August 2017, I calculated the pack Ir value using this method for Pack D, a 3S 1000mAh pack. It was 54.35 mOhm. While Bruce's test procedure allowed for the voltage drop of the battery during the test period, it did not allow for what was happening with the 1157 bulb in the parallel circuit. With the 1157 bulb in parallel, the actual circuit resistance dropped when his 1157 and spotlight bulb were 'on' together because they were in a parallel circuit. The total amp draw from the battery increased because of the lower resistance of the parallel circuit and that change was not reflected on the meter he used for noting the amp draw, which was only connected in the low resistance, higher amp draw, part of the circuit. Ignoring this created a higher pack internal resistance value than if the whole circuit had been considered. In a true 2-Tier DC Load test, a light amp draw preload is applied to the circuit. A heavier amp draw load is applied, in parallel, with the light amp draw load. The preload removes any surface charge and possible effects of passivation. The 2-Tier DC method is noted in the Energizer Technical Bulletin titled "Battery Internal Resistance". The 2-Tier DC method is described in the righthand column on page 1 of the document. 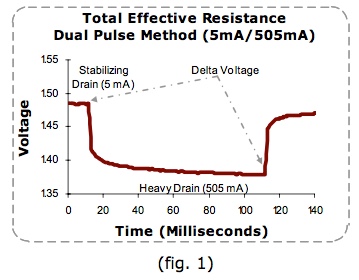 "As an example (fig. 1), if a 5 mA stabilization load is used in combination with a 505 mA pulse, the change in current is 500 mA. If the voltage changes from 1.485 to 1.378, the delta voltage would be 0.107 Volts, thus yielding a total effective resistance of 0.107 Volts / 500mA or 0.214 Ohms." The following was authored by Ivan Cowie, Chief Engineer, MaxVision. "To measure the DC internal resistance, I use the two-tier DC-load method. Select a load resistance that will lightly load the battery, apply the load for 10 seconds, then measure the terminal voltage V1 and the current with the load still connected. Then apply a higher load (lower resistance) for three seconds and measure the terminal voltage V2 and current I2. The DC internal resistance = (V1 - V2)/(I2 - I1). The two loads must be different enough to produce a very clear voltage delta [difference between the two voltages KM] while remaining inside the manufacturer's recommendations. Confidence in the number increases by making an additional measurement using another completely different resistor-pair. Note that the internal resistance (and impedance) of a battery are the primary causes of loss-of-capacity and inefficiency." This appears to be a circular reference with the information on the Battery University Web site. Many of the exact sentences in Ivan's article appear on the Battery University Web page and the dates coincide with the last paragraph in the section called "DC Load Method".
My real 2-Tier DC Load test for LiPo Pack D yielded an Ir result of 47.5 mOhm. I was surprised to find that there was little difference in the calculated battery internal resistance when using two 50W 12V Halogen bulbs as the load at about 8.5 amps and three of those bulbs at about 12.6 amps. All of the described methods indicated certain periods of time for the load, or loads, to be 'on'. There is nothing in the simple formula for calculating Ir that includes 'time'. The formula is (stabilized OCV minus load volts) divided by load amps. Bruce Simpson reduced the packs voltage over time by reducing the initial open circuit voltage (OCV) by 0.02 volts, the OCV drop that he calculated for 10 seconds. I investigated a method to remove calculating the battery's OCV voltage drop during the test period. I used the formula; (the final stabilized open circuit (OCV) after the load was removed, and the pack allowed to stabilize, minus the loaded volts) divided by the load amps. I know when the final OCV has stabilized by measuring each cell's voltage, over time, using my Fluke multimeter set to volts. It usually takes at least three hours for the voltage to stabilize in each cell, and sometimes more. 1. Charge the pack, or packs, to be tested to 3.85V per cell at a 1/2C rate. For my 3S 1000mAh packs, that is 0.5 amps as the charge rate.
This method was used in Aug. 2017 for 12 seconds on a 3S 1000mAh Revolectrix pack:
Items required:
I made a simple stand out of foam board to hold my iPhone 5. Anything that a stand can be built from is fine. I just happened to have some DTFB laying around. 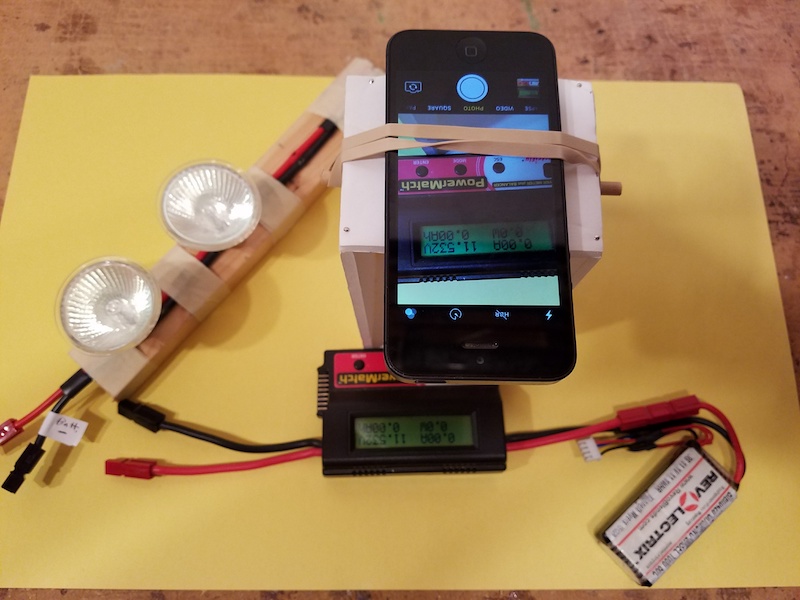
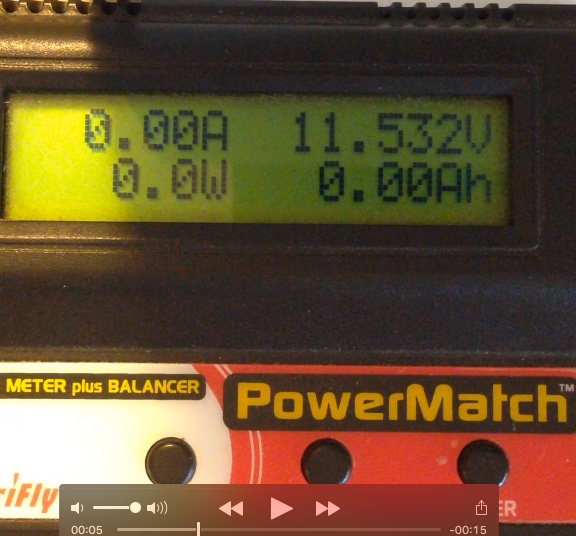
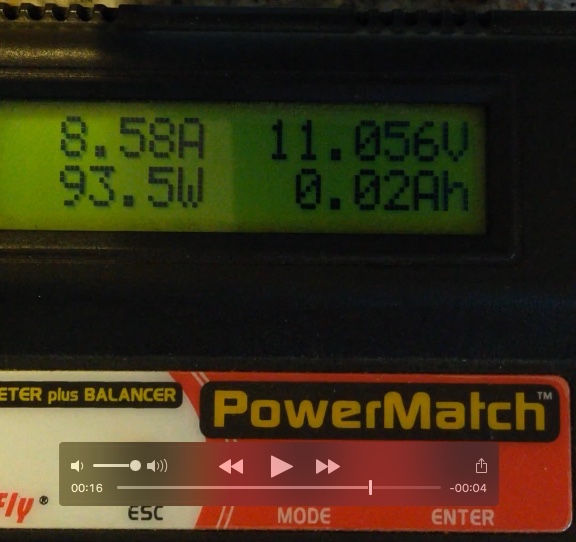
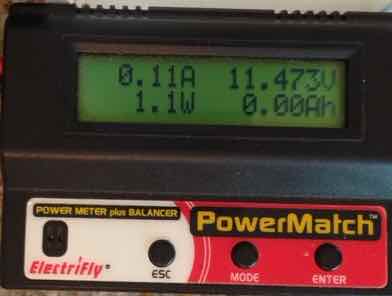
Photo of the Ir test setup using video recording To test this procedure, I used a Great Planes ElectriFly PowerMatch Power Meter Balancer from Tower Hobbies. It contains all of the instruments to provide data for this procedure. The PowerMatch can read individual cell voltages. It can be used to identify when an open circuit voltage (OCV) has stabilized. The PowerMatch displays the voltage and amperage on screen in live time. The length of the test period and video is not super critical. It takes at least one second for the surface charge, normal passivation effect, and heating of the bulb filaments to become stabilized. Again, I used 10 seconds for the target load 'on' period. It really doesn't matter too much if it is a bit shorter or a bit longer. The load must be disconnected before halting the video. The required voltages and amperage can be noted on the video during playback. Finally, after hours of resting, the PowerMatch is used to check individual cell voltages to determine when the final open circuit voltage (OCV) has stabilized, and then the end OCV is read on the meter. The actual discharging part of the test and gathering of the data from the video takes very little time. Waiting for the pack to stabilize does take a relatively long time. This method Aug. 2017: actual time 11 seconds
The table shows the Ir in milliohms. The unlabeled left column is the Ir calculated using the beginning stabilized open circuit voltage (OCV) and the right column using the stabilized ending OCV. The PowerMatch values are not included in the averages or medians as all other values were calculated using data as measured by the Emeter II. They are not calibrated to the same values. There is a small difference between using the initial stabilized open circuit voltage (OCV) and the final stabilized OCV. The average stabilized initial OCV was 11.53V. The 2-Halogen bulb discharge averaged about 8.5 amps at the end of the test period when the load was turned off. The only 3 bulb test was 12.6 amp at the end of the test period. The average voltage drop for the two 50W 12V Halogen bulbs was 8.5A * 0.051 = 0.43V using the initial OCV and 8.5 * 0.049 = 0.42 for the ending OCV. Not much of a difference for sure. The average voltage drop using the 2-Tier DC Load Method at 0.04750 ohms at 8.5 amps = 0.40V. Again an insignificant difference between the previous two Ir values at 8.5 amps. The average voltage drop for the three 50W 12V Halogen bulb was 12.6A * 0.051 ohms = 0.64V using the initial OCV and 12.6 * 0.049 = 0.62 for the ending OCV. Again an insignificant difference between the voltage drop values. All of the calculated Ir values for 8.5 amps suggest a loaded voltage of about 11.1V, give or take a little. The records indicate this is quite accurate. Even the PowerMatch, which does not display exactly the same voltage and amps as the Emeter II, showed 11.143V at 8.58 amps. That is still relatively close to the 11.1V, or so, of the Emeter II. It appears to be pretty much a toss up. All of the techniques, including Bruce's 'oops' technique, give reasonable pack Ir values that are somewhat comparable and close to computational correct. The 2-Tier method just seems to ME to be slightly better because it does not rely on the open circuit voltage (OCV) as part of the calculation. Using the final stabilized OCV helps to remove trying to estimate the 'run down' of the battery for the other methods of testing. To verify the results for LiPo Pack D, I made a prediction using 0.05 ohms, based on the data in the graph, at 3.85V per cell or 11.55V for the pack. A variation of the 2-Tier DC Load Method was used so that I could get four Ir calculations from it. My predictions: 11.55V - (8.5A * 0.05 ohms) = 11.13V heavy load
I predicted that the loaded voltage would be 11.13V at both 8.5A or 8.4A to allow some wiggle room. The recording instrument was the Emeter II. The pack temperature was somewhere between 220C and 240C, the same as the original test. Initial stabilized OCV 11.52, Light Load 11.50V and 0.5A, heavy load 11.14V and 8.5A @ 3 seconds, heavy load 11.13V and 8.5 A @ 3.5 seconds, final stabilized OCV 11.51V The loaded volt prediction was close using either 3 or 3.5 seconds of the 2-Tier Test during the heavy load part of the test. As a check to verify the Ir, I recalculated it. 2-Tier Calculation using 3 second heavy load values
2-Tier Calculation using end of test load values
Initial stabilized OCV Calculation
Final stabilized OCV Calculation
The Average for all four calculations, 0.04849 ohms or 48.49 mOhms. All of the calculations produced the expected results. This demonstrated that the pack's Ir is pretty much in the neighborhood of 0.05000 ohms or 50 mOhms. The Ir values calculated in this test session, using the initial stabilized OCV and final stabilized OCV, were very close to the other values presented in this article. The verification process continues next month, along with several other elucidations regarding battery pack internal resistance (Ir). November 5, 2017, Midwest RC Society 29th Annual RC Swap Meet
Location Northville Senior Community Center 303 West Main Street Northville, MI Admission Charge
Vendor Table Cost
For Information
Directions
THIS IS ALWAYS THE BEST & LARGEST SWAP MEET IN SE MICHIGAN! Upcoming Event
When: Friday August 25 4:00 pm - 9:00pm and Saturday August 26 from 9:00 am to 9:00 pm
Landing Fees: $15 (includes Pilot Pizza & Soda ) CD Marv Thomson 517-8027675 or mthomson@wowway.com Website: www.cardsrc.com Address: 8328 Otto Rd, Grand Ledge, Mi 48837 To Reach Ken Myers, you can land mail to the address at the top of the page. My E-mail address is: KMyersEFO@theampeer.org | ||||