 |
Flying High With Electric Power!
The Ampeer ON-LINE!
Fly the Future - Fly Electric! |
Site Table of Contents
| President: | Vice-President: | Secretary/Treasurer: |
| Ken Myers | Richard Utkan | Rick Sawicki |
| 1911 Bradshaw Ct. | 240 Cabinet | 5089 Ledgewood Ct. W. |
| Commerce Twp., MI 48390 | Milford, MI 48381 | Commerce Twp., MI 48382 |
| (248) 669-8124 | (248) 685-1705 | 248.685.7056 |
 | ||
| Board of Directors: | Board of Directors: | Ampeer Editor |
| David Stacer | Arthur Deane | Ken Myers |
| 16575 Brookland Blvd. | 21690 Bedford Dr. | 1911 Bradshaw Ct. |
| Northville, MI 48167 | Northville, MI 48167 | Commerce Twp., MI 48390 |
| 248.924.2324 | 248.348.2058 | 248.669.8124 |
| Mailed Ampeer printed subscriptions are no longer available.
The Ampeer is FREE on-line in Acrobat .pdf format and HTML with active links! | ||
| The Next Meeting:
Date: Saturday & Sunday, July 7 & 8 Time: 9 a.m. Place: Midwest RC Society 7 Mile Rd. Flying Field - Mid-America Electric Flies | ||
| What's In This Issue? | |
| Can the Data From the Castle Creations' Phoenix ICE 50 (8S) Be Used to Collect Inputs for Drive Calculator?, Ken Myers provides the answer after a couple of weeks of testing and comparing. | A Propeller Quiz, Ken Myers shares information about what to expect and not expect when using the same brand and same 'line' (APC E thin electric) of props with the same diameter and different pitches. |
| Keith Shaw Birthday Party Electric Fly-in 2012, some info and photos from the event. | Upcoming Mid-Am, flyer, map and hotels list for the 2012 Mid-America Electric Flies. |
|
By Ken Myers Forward I received my Castle Creations' Phoenix Ice 50 (8S) in August 2011. It is currently used in a "club trainer" plane and mated with an O.S. Motor OMA-3025-750 outrunner and 4S "A123" 2300mAh battery pack. When I first received it, I did not use the onboard logging capability of the Ice 50 to record the data to enter into Drive Calculator, a computer power system modeling program. I used my Emeter II to collect the data. I was in a "hurry" to get the "club trainer" flying and knew the procedure for data collecting for input into Drive Calculator using the Emeter II. This was not my first experience with a data logging electronic speed control (ESC). I reported on the Jeti Spin 44 and optional Jeti Spin Box in November of 2006. I was "underwhelmed" with its performance because it appeared to lack the accuracy I was desiring for data input into Drive Calculator. Radio Shack 22-168A Multimeter (no longer available)
Throttle:
Motor used during testing: O.S. Motor OMA-3825-750 outrunner
Batteries used during testing: 3S "A123" 2300mah, 4S "A123" 2300mAh, 12-volt Marine/RV deep cycle Procedures: 1.) The Emeter II data log, a type of csv (comma-seperated values) file, and the Ice 50 data.csv file were opened in a spreadsheet for viewing and comparing. 2.) The Multimeter data, and later tachometer data, were recorded on paper during the various test runs. 3.) The hook-up order for the voltage readings were the battery, Emeter II RDU, Multimeter set to volts, Ice 50. 4.) The amperage readings hook-up order was the battery, Multimeter set to amps, Emeter II RDU, Ice 50. 5.) 30-amp Anderson Power Pole (APP) connectors were used on all test instruments, except when taking voltage readings with the Multimeter. For the multimeter voltage readings, pins were inserted into the positive and negative wires and the multimeter clips attached to the pins. Day 1 If anything could go wrong, it did on this day. I hadn't thought through a good plan for testing, and it was somewhat random with very scattered results. Note: All of the data on spreadsheets is available upon request. Email me at mailto:kmyersefo@theampeer.org. Test 1 A resting voltage test showed that the voltage displayed on the Multimeter and Emeter II were very close, while the Ice 50 voltage was substantially lower. Two battery packs were used on Day 1. The first two measurements were taken using a 3S "A123" 2300mAh battery pack and the third test used a 4S "A123" battery pack. Test 2 was a no load motor run voltage test. Once again the Ice 50 recorded less voltage than the other two instruments. Test 3 was a no load amperage test, and the results were quite surprising. The Multimeter and Emeter II showed approximately the same amp draw while the Ice 50 showed almost all readings at 0.0 amps in the .csv file. Test 4, a voltage test, captured no relevant data. Test 4a was a light load (Graupner 8x6 Nylon prop) amperage test. The data showed quite a difference in the amp draw between the Ice 50 and the other two meters. Note: I was learning the methodology to use to get comparison numbers, so a lot of the values in this series are quite questionable. Test 4b was the first RPM capture. It alerted me to the fact that the Emeter II RPM, read by the phase tachometer through the RDU, and Ice 50 could be somewhat close. I needed a better procedure to capture relevant data. The Multimeter and Emeter II tracked quite closely and both were different from the logged data of the Ice 50. Averaging the data was a very poor idea for comparison purposes. Deleting some of the data files was very foolish! A procedure was created to follow during the testing. A procedure sheet was used to record the Multimeter and Tachometer readings.
Log 1 showed that the idle voltage was once again very similar on the Multimeter and Emeter II and lower in the Ice 50 data file. The no load voltage data showed the same trend; Emeter II and Multimeter similar, Ice 50 lower. Log 2, the no load amp draw log, confirmed that the Multimeter and Emeter II were tracking together and that the Ice 50 data file was almost all zeros, except for an occasional few digits here and there with no discernible pattern. Log 3, the light load amp test, showed the Multimeter and Emeter II reading about the same while the Ice 50 recorded a lower amp draw. Log 4, a light load test, showed a surprise. The Multimeter was used to read volts during this test. Again the Multimeter and Emeter II supplied similar voltage readings with the Ice 50 capturing a lower voltage. The amperage, which was recorded only by the Emeter II and Ice 50 showed the Emeter II capturing a higher amp draw than the Ice 50. With the Multimeter removed from the system, both the Emeter II and Ice 50 captured higher amps than in Log 3 with the Multimeter, set to amps, inline. This indicated a high resistance in the Multimeter when used as an ammeter. Once again the RPMs tracked very closely on the Tachometer, Emeter II data and Ice 50 data. Note: By the conclusion of the testing, I found that as the load lightened, the Ice 50's amp capture would drop to equal or below the Emeter II capture. Also, as the load increased, the Ice 50's amp capture would exceed the Emeter II capture. After looking over the first two series of tests, it was apparent that the Multimeter and Tachometer results were close to the Emeter II logged data. From what I called Logs 3 and 4 on Day 2 of the testing, it was also apparent that the Multimeter had a very large resistance when used as an ammeter.
Test 1 - no load (maximum recorded values presented here - all values shown on the spreadsheet)
The Ice 50 in line with Emeter II showed exactly the same voltage and amp draw through the whole data log; 12.52v and 0.4 amps. The RPM values did drop as expected, even while the voltage was recorded as 12.52 throughout the test. The amp draw remaining the same was not expected, as it is typical for both the voltage and amperage to drop during the test run of the motor, as it did for the Emeter II.
Test 2 (APC 13x8E prop)(maximum recorded values presented here)
For illustration purposes, the Drive Calculator derived estimates are used here.
Drive Calculator Predictions for the O.S. OMA-3825-750 motor (www.theampeer.org/OMA-3825-750/OMA-3825-750.htm), at approximately the same RPM, in bold, recorded data in italics:
Ice 50: 10.28 Vin, 28.2 amps, 6896 RPM, 232.3 Pout, 289.9 Pin
Test 3 (APC 12x6E prop)(maximum recorded values presented here)
With only a small RPM difference, the watts out are quite similar and therefore the watts in should also be similar.
Ice 50 w/Emeter II inline: 10.73 Vin, 22.4 amps, 7509 RPM, 198.5 Pout, 240.4 Pin
Ice 50: 10.88 Vin, 23.0 amps, 7598 RPM, 206.0 Pout, 249.7 Pin
Test 4 (Graupner 8x6 Nylon prop)(maximum recorded values presented here)
Again, with only a small RPM difference, the watts out are quite similar and therefore the watts in should also be similar.
Ice 50: 11.92 Vin, 9.2 amps, 9096 RPM, 89.5 Pout, 109.2 Pin
Again, the captured data was identical for the data capture of the Ice 50 with and without the Emeter II in line. Using the Ice 50 identical data of 11.92 Vin, Drive Calculator estimates 9.2 amps, 9096 RPM, 89.5 watts out of and 109.2 watts in.
The Ice 50, when hooked directly to the battery, as expected, did record a higher voltage and amp draw than when the Emeter II was in line, but still not as high of a voltage as the Emeter II, except for the lower power test. The O.S. OMA-3825-750 outrunner was completely and carefully retested including the drill press Kv test. The results appear on the spreadsheet on the tab named 3825-750 retest. The drill press test resulted in an 805Kv.
Example from Spreadsheet tab 3825-750 with the APC 12x8E prop:
Except for being unable to measure the Io (no load values) the Ice 50 data is close enough to the Emeter II readings to call its results acceptable for providing data that can be used to keep the power system from being overloaded, if the Ice 50 is used for the reference.
Example from Spreadsheet tab 3825-750 with the Graupner 8x6 Nylon prop (lightest load tested):
Example from Spreadsheet tab 3825-750 with the APC 13x8E prop (heaviest load tested):
The RDU of the Emeter II is a resistance, therefore there is a voltage drop (power loss) through it. The lower voltage logged by the Ice 50 was no surprise. The increased amperage reading was a surprise, as the amp draw should have decreased as well, due to the power loss through the RDU unit. With the added resistance of the RDU of the Emeter II the Ice data should have been lower than the data captured by the Emeter II. The power in (Pin) was always higher for the Ice 50 data.
Example from Spreadsheet tab 12v-test with the APC 13x8E prop (no Emeter RDU inline):
I did another test on April 29 that confirmed the Multimeter and Emeter voltage continued to track together while the recorded voltage data of the Ice 50 was lower throughout the test. Multimeter: resting before test 12.85 volts, end of motor run 10.26 volts, resting after testing 12.45 volts
With the test equipment on-hand, there is no way to determine which, if either, of the devices is correct. The Ice 50 cannot be used to capture data for Drive Calculator. It does not capture no load motor testing data. The voltage it captures does not appear to be the input voltage required by Drive Calculator.
There have been a few comments by others on the Internet about the accuracy of the Ice data logging. March 2010, www.rcgroups.com/forums/showpost.php?p=14629573&postcount=6328 Thomas Porfert, Castle Creations, "I recommend using the data logging for comparative purposes, and not as exact values. You can get an idea about general trends and see how the controller reacts to different setups (IE prop size, timing advance etc.). Having a watt meter in line while bench testing to verify numbers is not a bad idea. Future software updates may improve accuracy, but please count on some variances." May 28, 2010, battery use mAh measuring in question, www.rcgroups.com/forums/showthread.php?t=1251859 April 2011, screen shot comparing the Ice Graph Screen to another logging unit's screen: www.rcgroups.com/forums/showpost.php?p=17961922&postcount=1 November 2011, Is Castle craetions data logging accurate? www.rcgroups.com/forums/showthread.php?t=1542846 I will continue to use the Emeter II for capturing data for input into Drive Calculator.
A Propeller Quiz
|
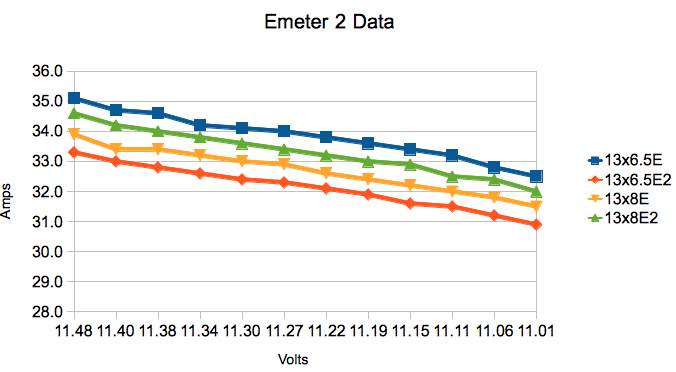
| The graph above shows the amp draw data for two APC 13x6.5E thin electric props and two APC 13x8E thin electric props as recorded by an Emeter 2 at similar voltages. The props are labeled A, B, C, and D for the quiz. Use some handy paper to write down which prop you believe is represented by each line in the graph. Remember there are two of each prop. Clicking on the graph will open a new window with the correct order.
During testing for input data for Drive Calculator for the O.S. Motors OMA 3825-750 outrunner, and while collecting data for the previous article comparing the data capture of an Ice 50 to the Emeter II, an anomaly arose. The APC 13x6.5E appeared to draw more amps and turn at a lower RPM than the APC 13x8E.
All four props say "APC C-2" on the hubs and all four hubs have a diameter of 0.8 in./20.32mm. 13x6.5E wt. 26.25g, hub thickness 0.37 in./9.398mm, measured pitch 6.6"
Note: the hub thickness for the 13x8E props was triple checked. There is a 0.01" difference. Data was captured by the Castle Creations Ice 50 amp ESC and the Emeter II (2). The data was logged onto a spreadsheet.
All testing was completed in the basement with the temperature at about 60-deg F/15.5-deg C for all tests.
Which prop would fly a given plane the best? It all depends on the plane's mission. 1. ALWAYS USE A POWER METER. A particular prop may give surprising results.
The spreadsheet shows some very interesting information about the data captures of the Ice 50 ESC. It clearly shows that the data captured does not drop as expected and that there appears to be some kind of program in the ESC's computer that provides for the appearance of only certain 'numbers' in the data. Scrolling through the Ice 50 data for these props demonstrates this phenomena.
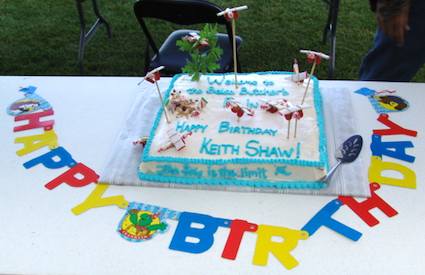
The Keith Shaw Birthday Electric Fly-in
The Coldwater, MI Balsa Butchers' annual Keith Shaw Birthday Electric Fly-in was held on an extremely windy June 2 & 3.
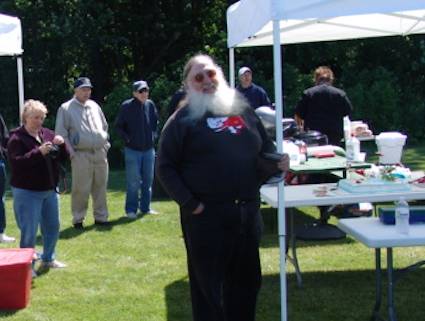
The birthday boy himself. The name of the image gives away his age. :-) The Upcoming Mid-Am, July 7 & 8, 2012 |
To Reach Ken Myers, you can land mail to the address at the top of the page. My E-mail
address is:
kmyersefo@theampeer.org
EFO WEB site: http://www.theampeer.org